HOME
Talks
Videos
About
--------------------------------------------------------------------------------------------------------
The climate history you were not taught in school.
Let knowledge guide you through the pitfalls of the climate crazed media.
Global Warming Inhibits Hurricane Activity -
As Indicated By Decreasing Tropical CAPE Values.
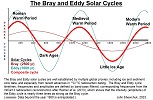
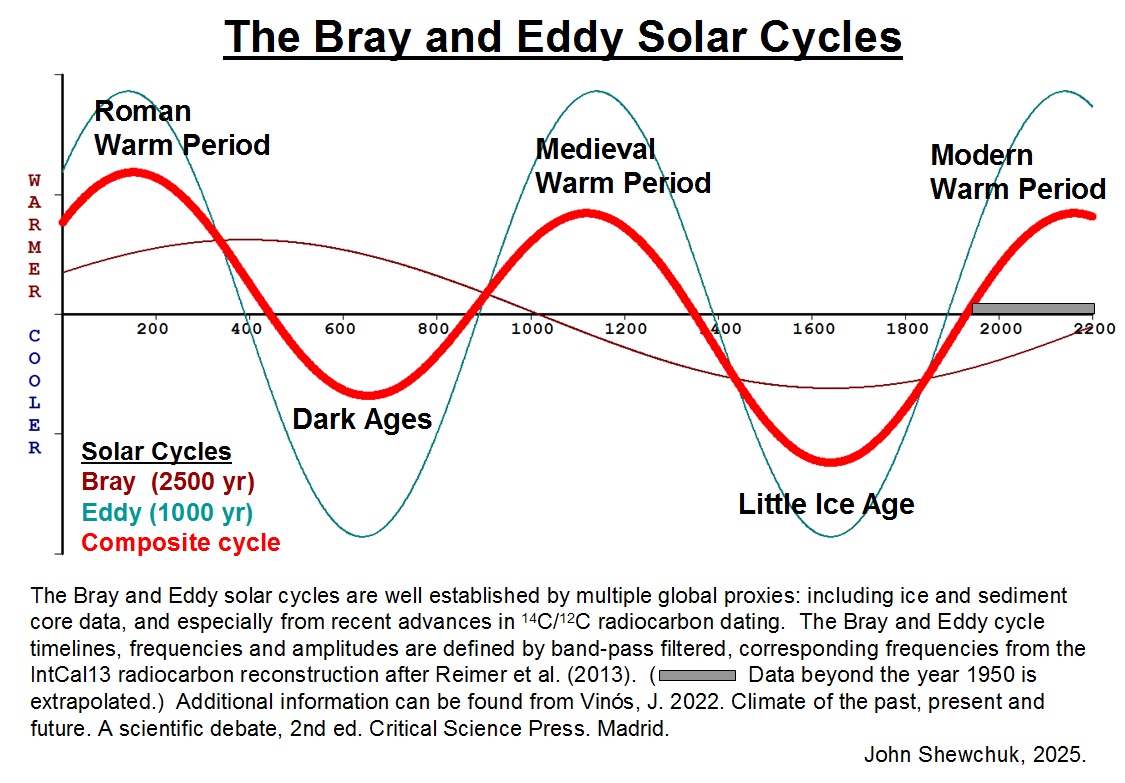
The sun controls our climate. The Bray and Eddy solar cycles directly impact climate change.
They are part of many overlapping sun-driven cycles, including the longer term Milankovitch “ice age” cycles, and the shorter term Feynman and Schwabe sunspot cycles.
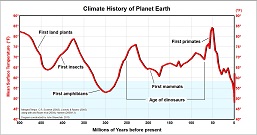
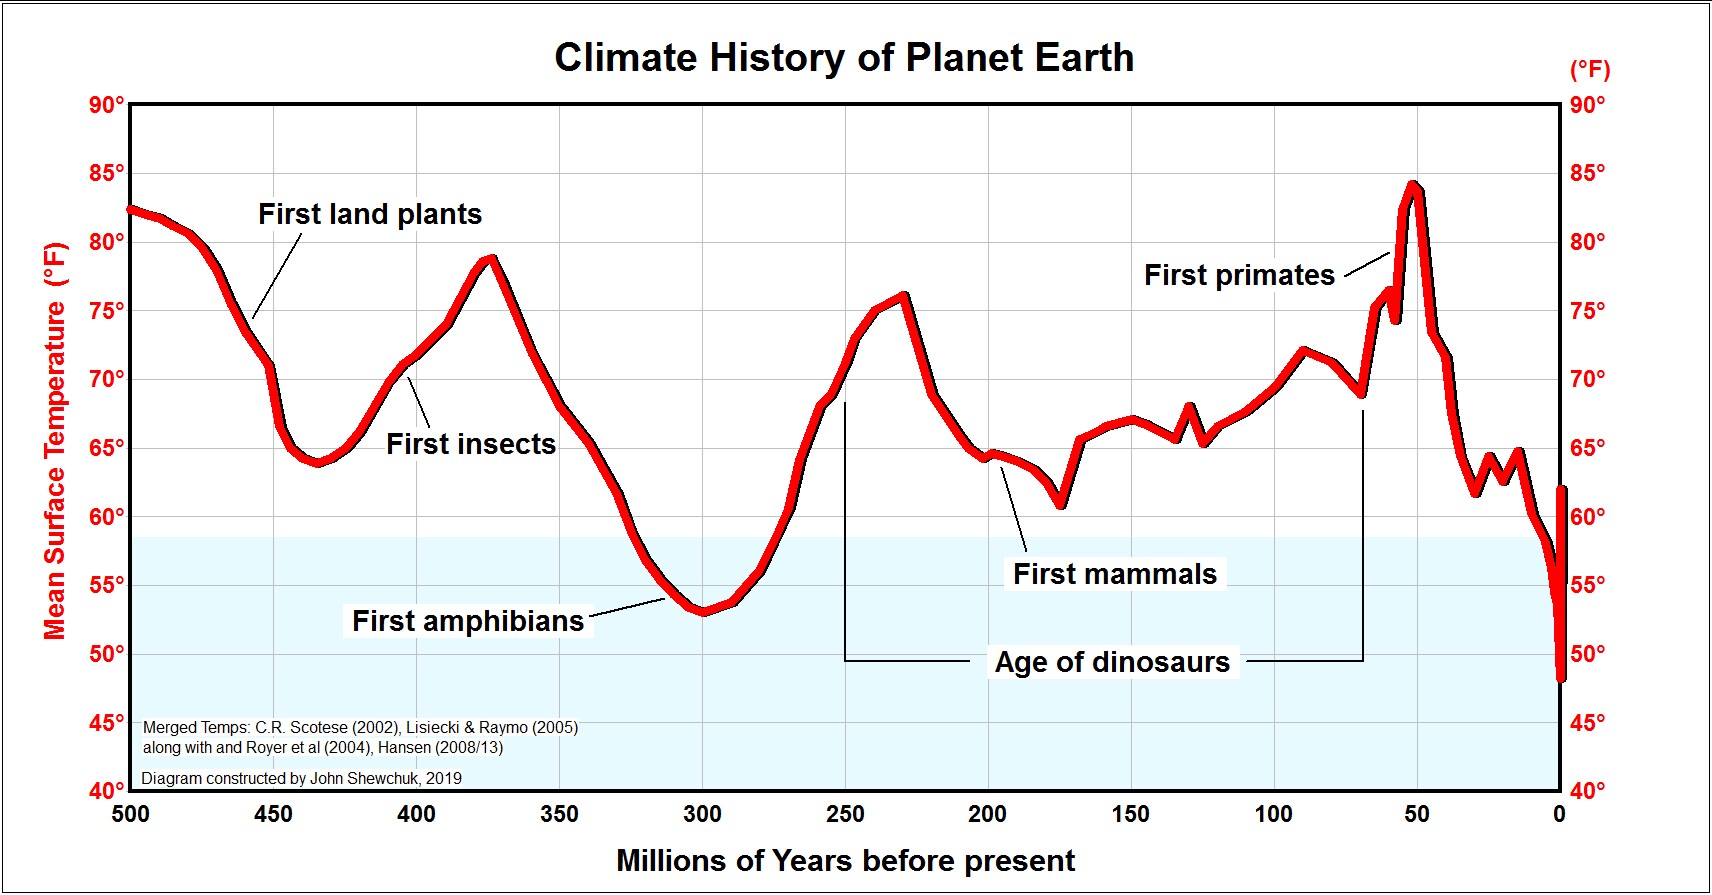
Global Temperature History. This chart shows the
temperature history of the earth for the last 500 million years of its 4.5
billion year history. This chart clearly shows that the earth is now
in a relatively cold period with respect to its recent 500 million year
history.
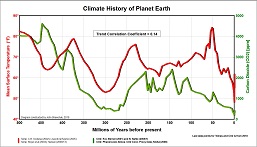
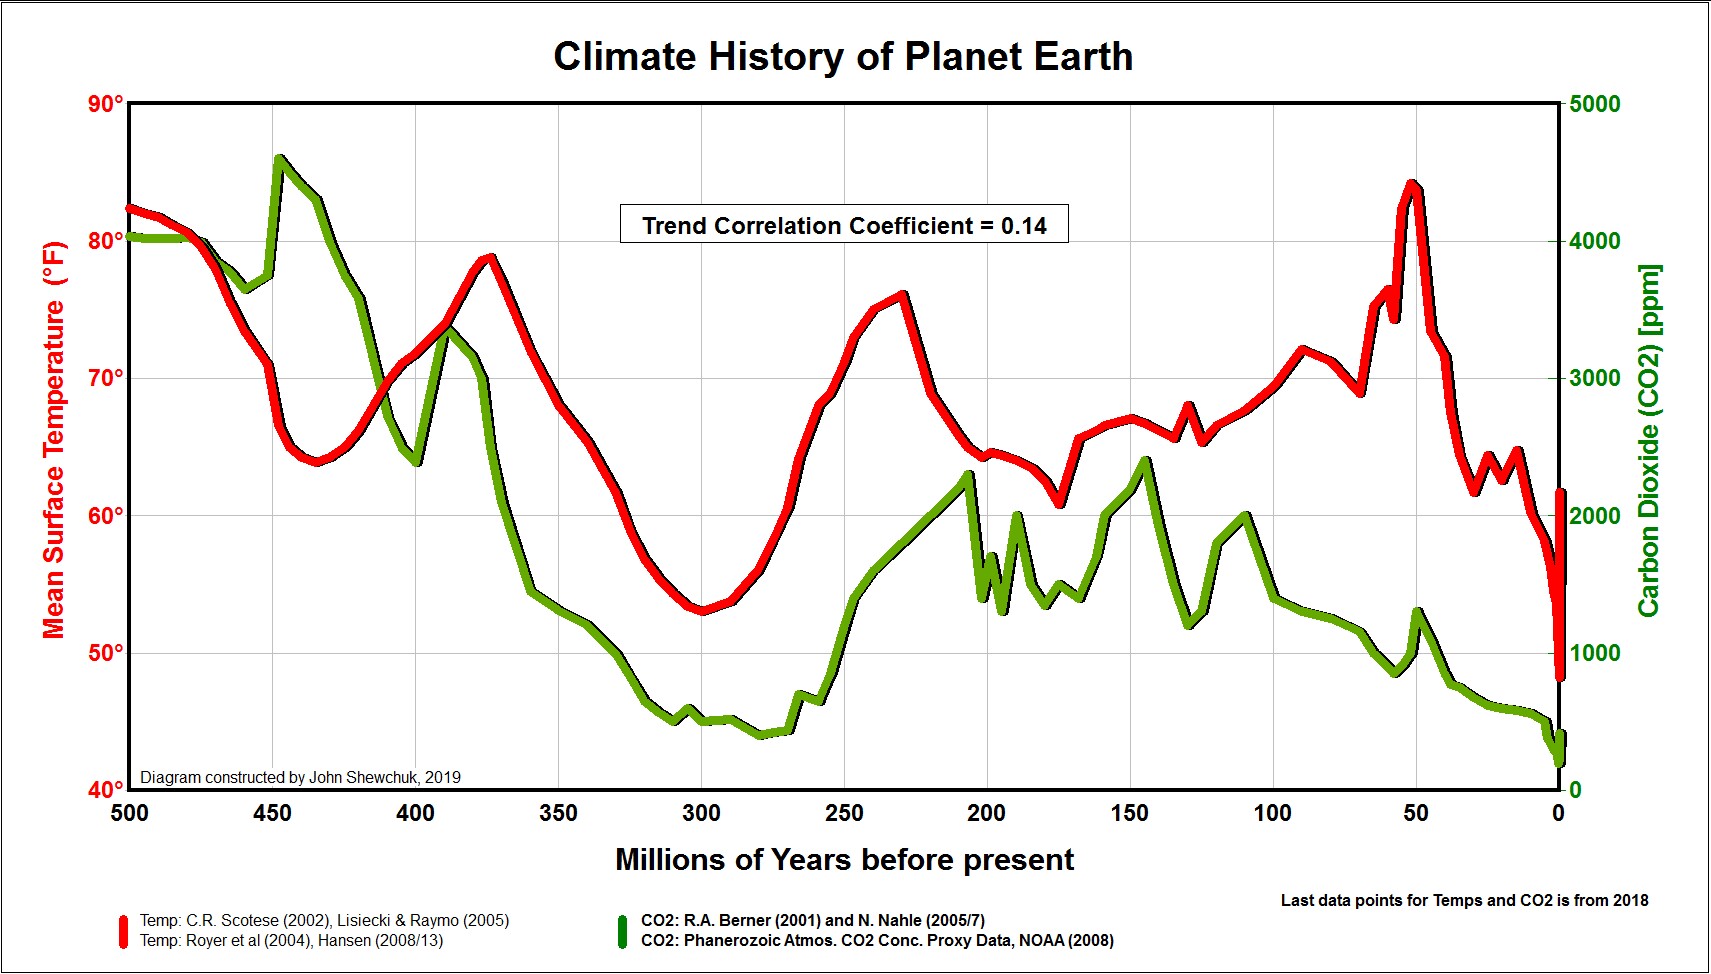
Temperature and CO2 History. Notice that Temperature and Carbon Dioxide (CO2) are NOT linked.
CO2 does NOT control global temperatures.
In fact, this graph shows that global temperature and CO2 trends have a very weak correlation — in other words — not statistically
significant.
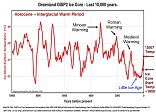
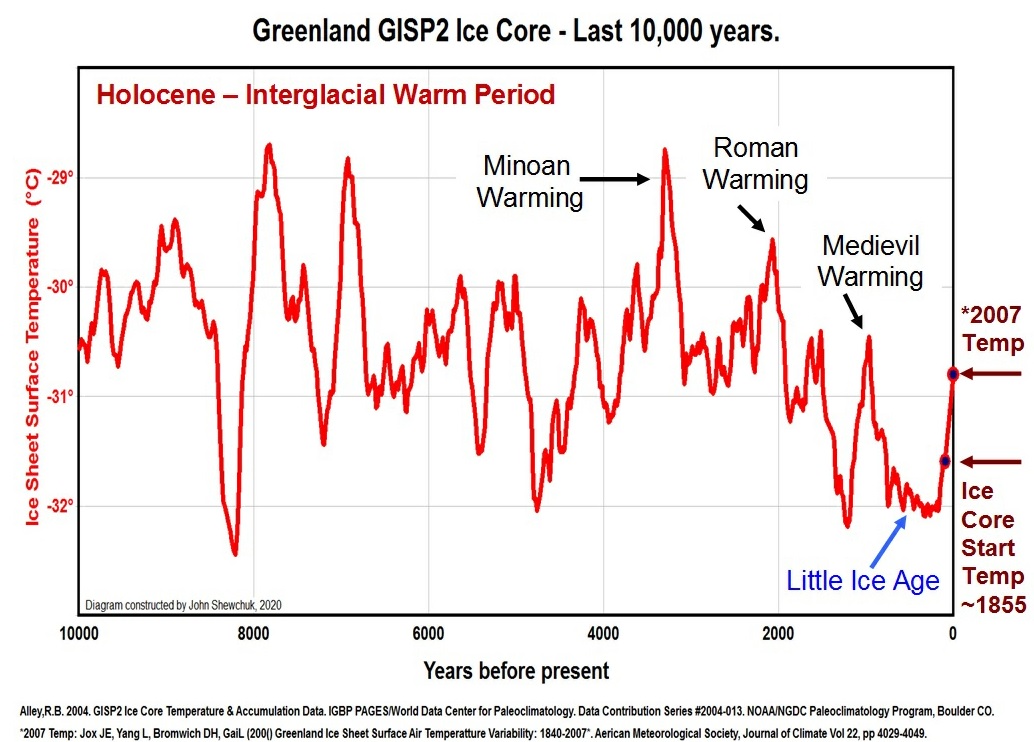
The Greenland (GISP2) ice core data show temperatures during our current
Interglacial Warm Period - called the Holocene. It's important to note
that the Minoan, Roman, and Medieval Warm Periods were all warmer than today
- where each are called climatic optimum, because humanity thrived during
these warmer times.
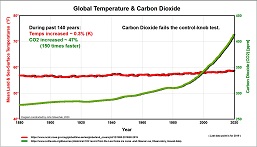
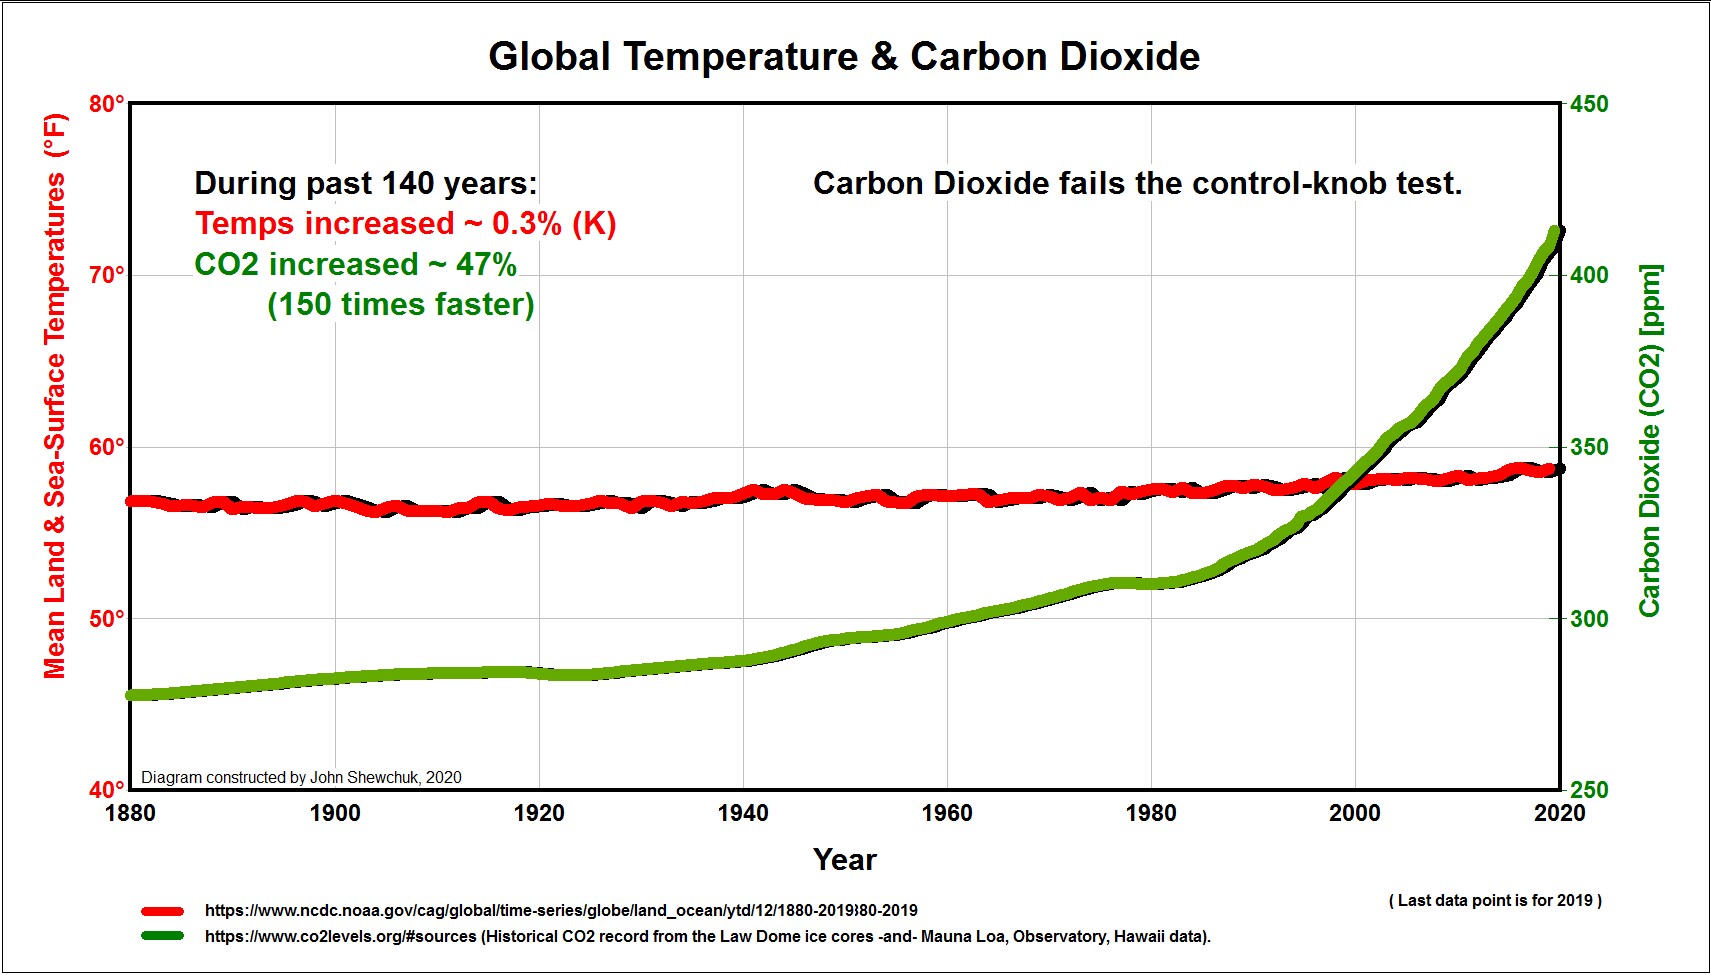
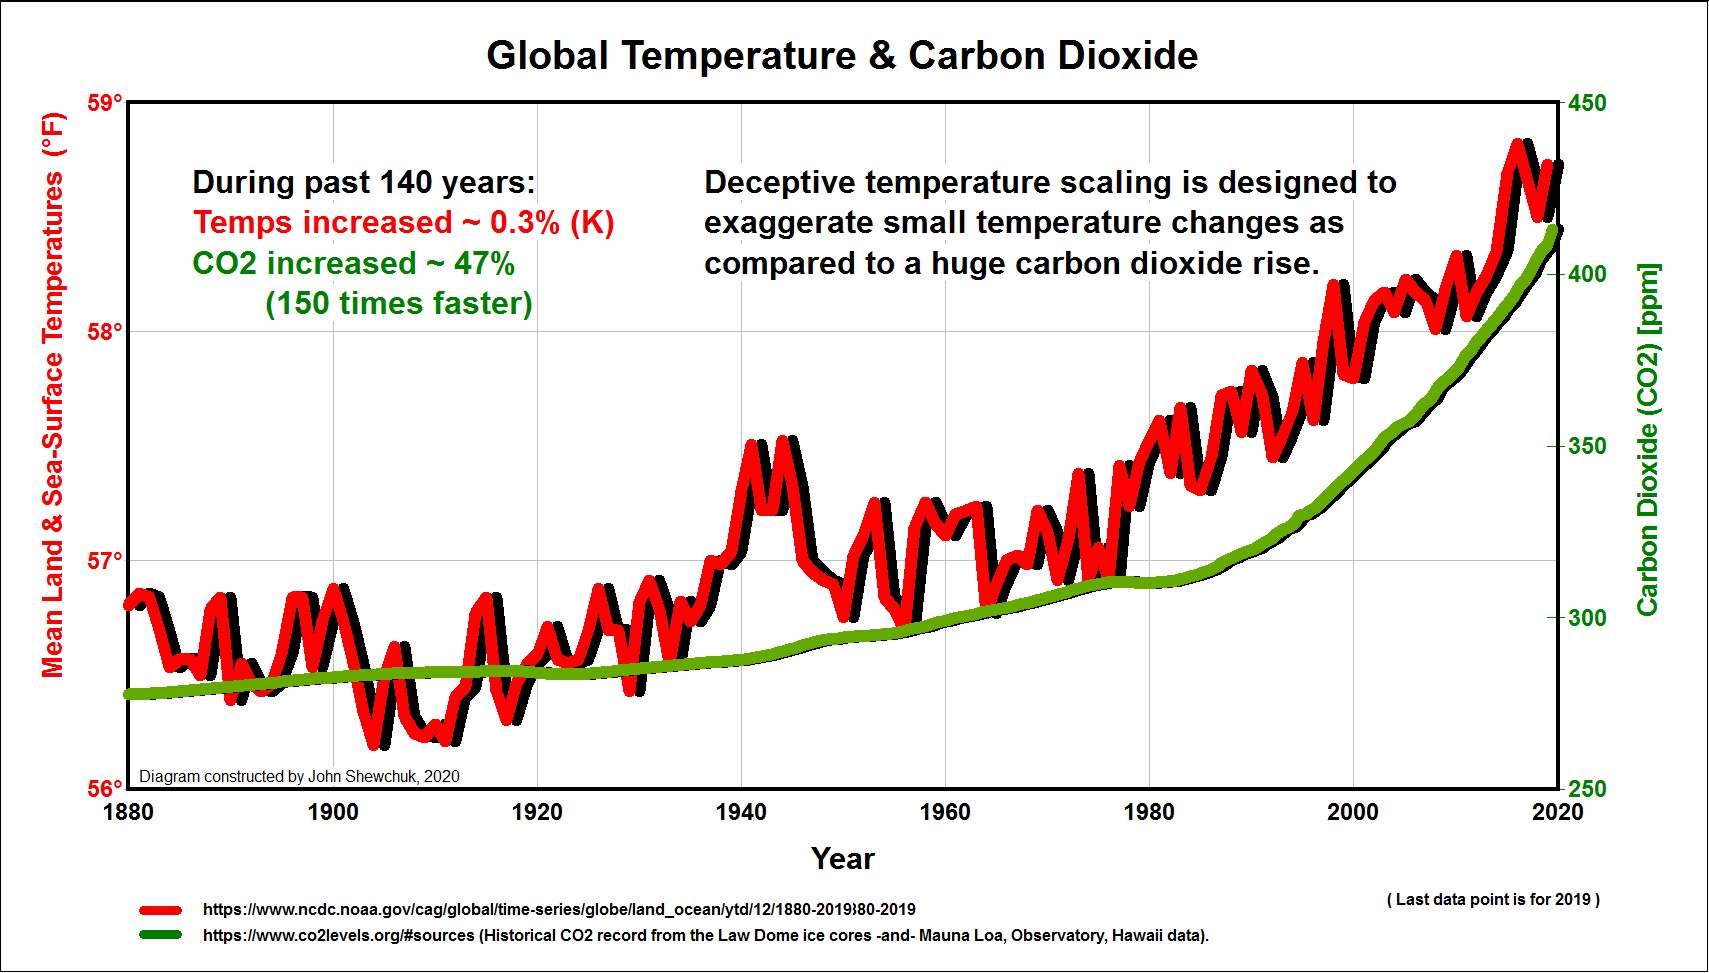
Temperature and CO2 history. This chart clearly shows
that even though CO2 dramatically increased during the past 25 years,
corresponding Temperatures only rose slightly. This is because CO2 is
a limited greenhouse gas, because its influence is logarithmically reduced
as its gas volume increases. To see how climate alarmists deceive the casual viewer
about the true nature of the Temperature / CO2 relationship
click here. It's the same graph, where only the Temperature scale
has been altered to maximize deception.
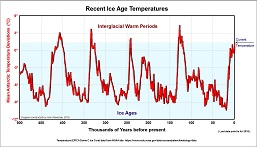
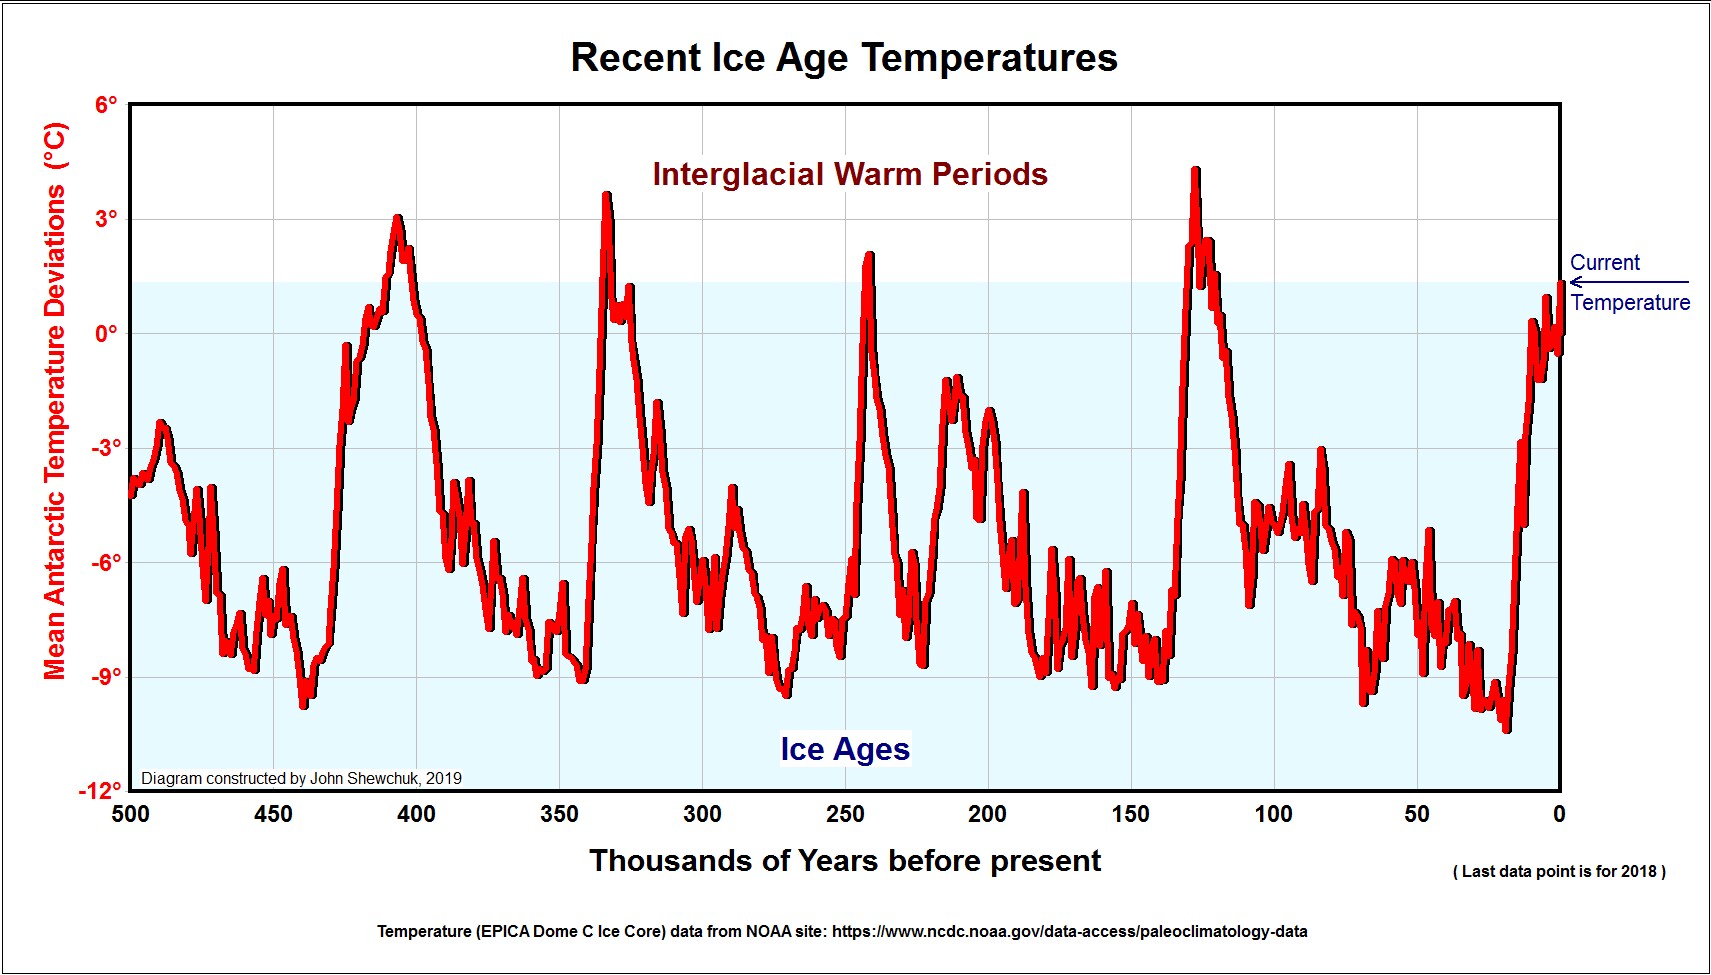
Recent Ice Age Temperatures. This chart shows the
cyclic nature of recent Ice Ages - approximately every 110,000 years
Similar charts from multiple sources clearly show that the current global
temperatures are far below those estimated high temperatures seen during
prior Interglacial Warm Periods. Regardless of any CO2 affects, higher
temperatures and associated sea levels (see next chart) are entirely
possible before the next Ice Age begins.
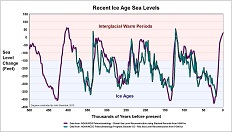
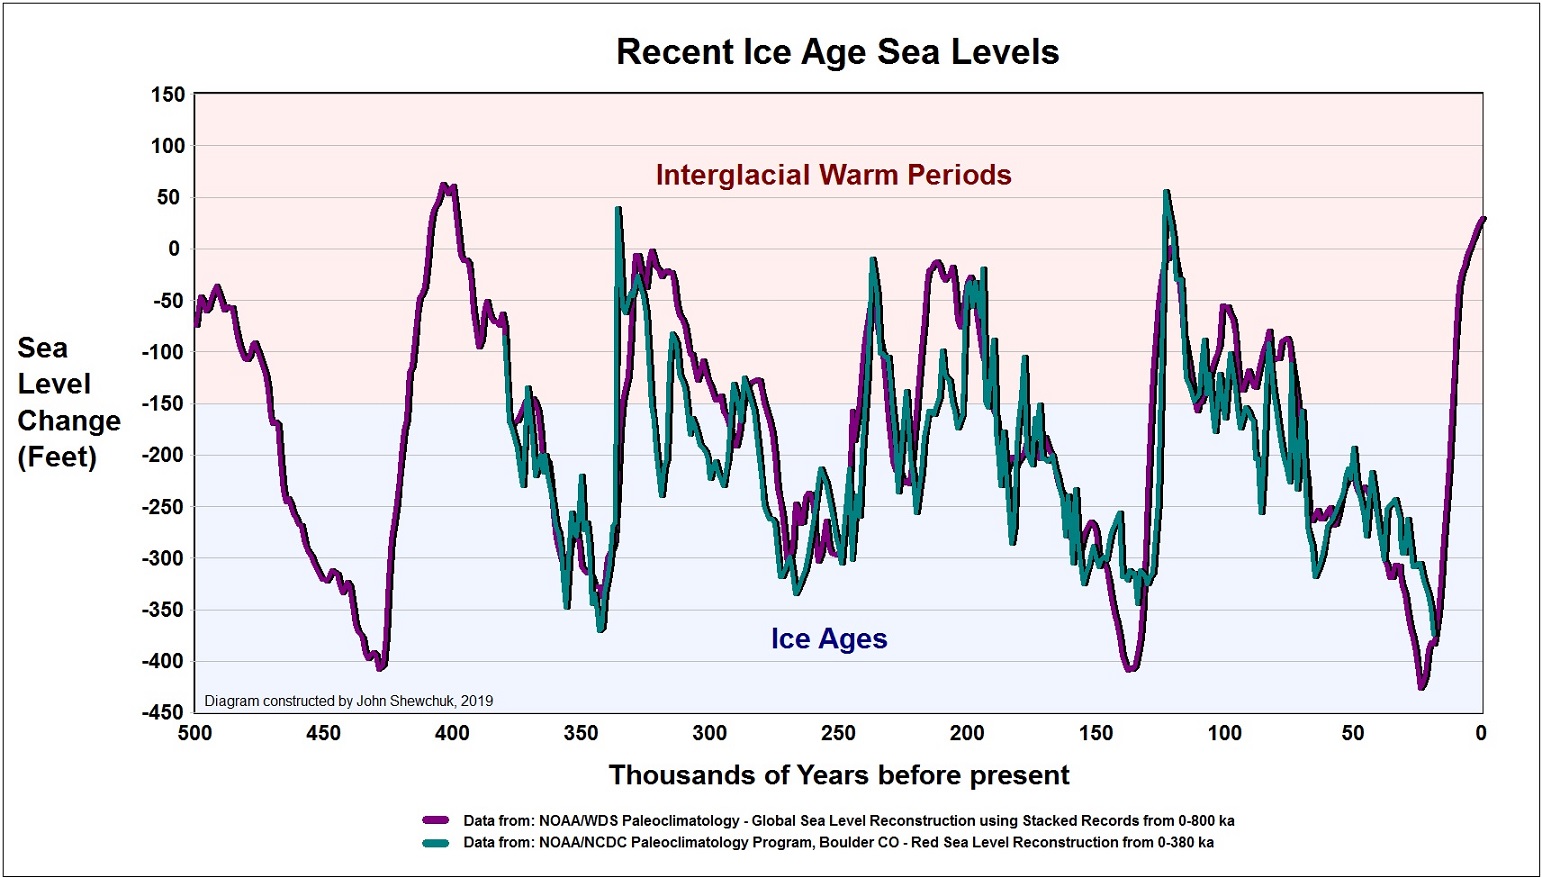
Historic Sea Levels during recent Ice Ages. This chart
shows that sea levels were higher during some prior Interglacial warm periods.
In fact, during the last warm period, multiple data analyses estimate that sea levels were 15 to 20 feet higher than today. In other words, today's increasing temperatures and
rising sea levels are normal during Interglacial warm periods. As past
Ice Age histories show, sea levels will continue to rise in our Warm
Period, and then begin to fall as we enter the next Ice Age glaciation.
Site by: John Shewchuk -- Lt Col, USAF, Retired, Meteorologist
Contact: info@climatecraze.com